There is also a black and white version of this page available at http://www.math.cmu.edu/~bkell/21110-2010s/conflict-graphs-bw.html, which may be better suited for printing or for people who have difficulty seeing colors.
Pages 198–201 of Problem Solving Through Recreational Mathematics discuss the problem of coloring graphs and maps. The basic idea is to color the vertices of the graph (or the regions on the map) in such a way that adjacent vertices (or regions that share a border) are given different colors, and to do this with the fewest number of colors. (Note that, on a map, regions that meet only at a single point are not considered to share a border, and so Utah and New Mexico, for example, can be given the same color.)
The book states (in Theorem 6.8) that any planar map can be colored with at most four colors, which is a very famous theorem in mathematics called the four-color theorem. This fact was first proposed in 1852, though at that time it was only a conjecture, since it had not yet been proved. Over the next 124 years many mathematicians tried and failed to prove it. One attempted proof, given in 1879 by Alfred Kempe, was believed to be correct until Percy Heawood showed in 1890 that it was flawed; another proof, proposed in 1880, was shown to be incorrect in 1891. The first correct proof was given in 1976 by Kenneth Appel and Wolfgang Haken.
(It should be noted that this proof is incredibly lengthy, treating thousands of special cases one by one, and had to be generated by a computer. It sparked a great deal of controversy at the time, because it is so long that it is impossible for a single person to understand and verify it all. Since then the proof has been regenerated in several different ways, and simplified to some extent, but no one has yet been able to produce a proof that is simple enough and clear enough for any person to comprehend. For this reason there is still some doubt among some mathematicians about the correctness of Appel and Haken’s proof, though most mathematicians accept the proof as valid.)
The four-color theorem is of great importance to theoretical mathematics because the search for a proof provided a motivation for vast new areas of research, many of which are still being investigated today.
Despite its origins, the four-color theorem is not especially useful to mapmakers, for several reasons:
However, the idea of graph coloring in general, and the theorems that have been proved about it, are surprisingly useful in many different scenarios, some of which appear at first sight to have nothing to do with coloring.
For example, the game of Sudoku, played in a 9 × 9 grid, can be modeled by a graph having 81 vertices, one for each square, in which two vertices are joined by an edge if the corresponding squares are in the same column, the same row, or the same 3 × 3 block. Solving a Sudoku puzzle is equivalent to coloring this graph with 9 colors, representing the digits 1 through 9, in such a way that no two adjacent vertices are given the same color. (Why is this?)
As another (rather abstract) example, the ideas of graph coloring are used to decide how to efficiently allocate the memory available in the processor of a computer when programs are running.
The application we will be looking at here, though, is scheduling.
Imagine that the legislature of a certain state has five committees, whose members are as follows:
| Agriculture | Education | Health and Human Services | Natural Resources | Revenue |
|---|---|---|---|---|
| Brown Davis Johnson Miller Williams |
Anderson Jones Martinez Smith Williams |
Martin Moore Smith Thomas Wilson |
Brown Jackson Moore Taylor Thompson |
Garcia Harris Johnson Taylor White |
These committees would like to schedule weekly four-hour meeting times. Whenever a committee is meeting, the legislature as a body cannot meet, because some of its members will be busy in committee meetings. So, while it would be possible to schedule the five committees at five different times, this would consume 20 hours of the working week, and the legislature decides that it would be better to schedule the committees so that two or more of them are meeting at the same time whenever possible (in different rooms, of course). However, not all committees can meet at the same time, because some people are members of more than one committee; Williams, for example, is on both the Agriculture Committee and the Education Committee. What is the best way to schedule these five committees?
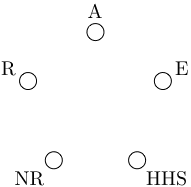
One way to tackle this problem is to model it with a graph. Let’s represent the committees with vertices. We’ll draw the vertices as open circles so that we can color them (we’ll see why in a bit).
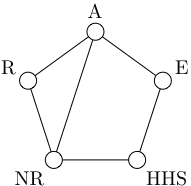
Now we need to represent the potential conflicts among the committees. A conflict exists if two committees share a member. So, for example, there is a conflict between the Agriculture Commitee and the Education Committee, since Williams is a member of both. On the other hand, there is no conflict between the Education committee and the Revenue Committee, because they have no members in common. We shall represent a conflict between two committees by drawing an edge between the corresponding vertices. The resulting graph is called a conflict graph. After identifying all of the conflicts among these five committees and drawing the appropriate edges, we get the following graph.
Next, let’s color the vertices of this graph, according to the rules of graph coloring: No two adjacent vertices can be given the same color, and we want to use as few colors as possible. We find that we can color this graph with three colors (red, blue, and yellow) as shown below.
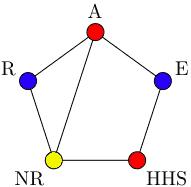
How does this coloring give us a schedule for the committee meetings? We can interpret the three colors as representing different, non-overlapping four-hour blocks in which a committee can meet (for example, red can represent Monday 8:00–noon, blue can represent Wednesday 1:00–5:00, and yellow can represent Thursday 2:00–6:00). Since we have used only three colors, we need to have only three of these four-hour blocks. Then we schedule each committee to meet at the time corresponding to the color of its vertex. For example, using the times listed above, we could schedule these committees to meet at the following times:
| Agriculture | Education | Health and Human Services | Natural Resources | Revenue |
|---|---|---|---|---|
| Monday 8:00–noon | Wednesday 1:00–5:00 | Monday 8:00–noon | Thursday 2:00–6:00 | Wednesday 1:00–5:00 |
In this way we have scheduled the committee meetings so that in all they take up only 12 hours a week. Of course, we could choose other four-hour blocks, as long as the blocks do not overlap.
Why does this method work? The key lies in the fact that the edges of the conflict graph represent all of the possible conflicts among the committees, and we have colored the vertices in such a way that adjacent vertices (representing committees that could potentially have a conflict) are given different colors (i.e., they are scheduled to meet at different times). The only committees that are scheduled to meet at the same time are those that have no members in common.
Here is a straightforward method that can be followed to color the vertices of a graph. (Note that it may not always produce a coloring with the least possible number of colors.)
The four-color theorem is an important result, but it does not apply to graphs in general. It applies only to graphs that can be drawn on paper in such a way that none of the edges cross (such graphs are called planar graphs). A dual graph corresponding to the regions of a map, as described in Problem Solving Through Recreational Mathematics, is always a planar graph, so the four-color theorem applies. However, when coloring a conflict graph you may find that you need more than four colors.
For example, if every pair of committees in the example above had some member in common, then no two committees could be scheduled to meet at the same time, so five different meeting times would be necessary. The corresponding conflict graph would be a complete graph with five vertices. This graph cannot be drawn on paper without edges crossing, and it requires five colors if it is to be colored according to the graph coloring rules.
You should also be aware that the algorithm for graph coloring described above does not always use the least possible number of colors. Even if we know that a graph can be colored with, say, four colors, it is often necessary to backtrack to find such a coloring. For example, Martin Gardner published an article in the April 1975 issue of Scientific American as an April Fools’ joke, in which he claimed that the following map had been shown to require five colors:
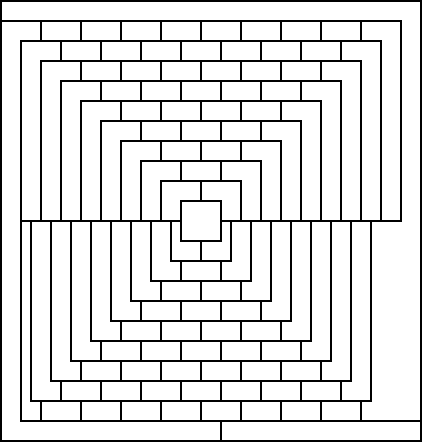
Of course, we know (from the four-color theorem) that this planar map can be colored with just four colors, but finding such a coloring is difficult. Can you do it?
There is no known method that is reasonably quick, works for all graphs, and always uses the fewest possible colors. (It is believed that no such method exists.) From this point of view, the algorithm described above is about as good as any other. It might not always be perfect, but often it’s good enough.
Ten friends have several interests in common, as shown in the table below.
| Basketball | Classic rock | Film | Painting | Political discussion | Wine tasting |
|---|---|---|---|---|---|
| Andrew Leah Megan Tanya |
David Steve Whitney |
Andrew Eric Megan Sarah |
David Joe Sarah Whitney |
Joe Leah Steve Whitney |
Eric Megan Tanya |
They decide to get together regularly to enjoy their interests. There is an activity center they can rent by the hour that has many rooms (and a gym), but they must rent the whole center, so they would like to schedule as many interest groups at the same time as possible. Of course, they cannot schedule two groups at the same time if there is someone who wants to participate in both groups. Suppose that each interest group wants to meet for two hours each week.
There are seven final exams to be scheduled at a small college; the exams are for accounting, calculus, geography, history, Latin, physics, and sociology. Clearly these exams must be scheduled so that no student has two exams at the same time. These are the pairs of courses that have students in common:
What is the minimum number of final exam times required? How should the final exams be scheduled?